
Highlights which items and categories contribute most to revenue as a share of total sales.
How to open this report
- Log in to FoodEase Office.
- In the sidebar, expand Reports and click View All Reports.
- Search for Sales Mix Summary or scroll the list.
- Click the report name or View Report.
You can also open it directly: Sales Mix Summary in Office.
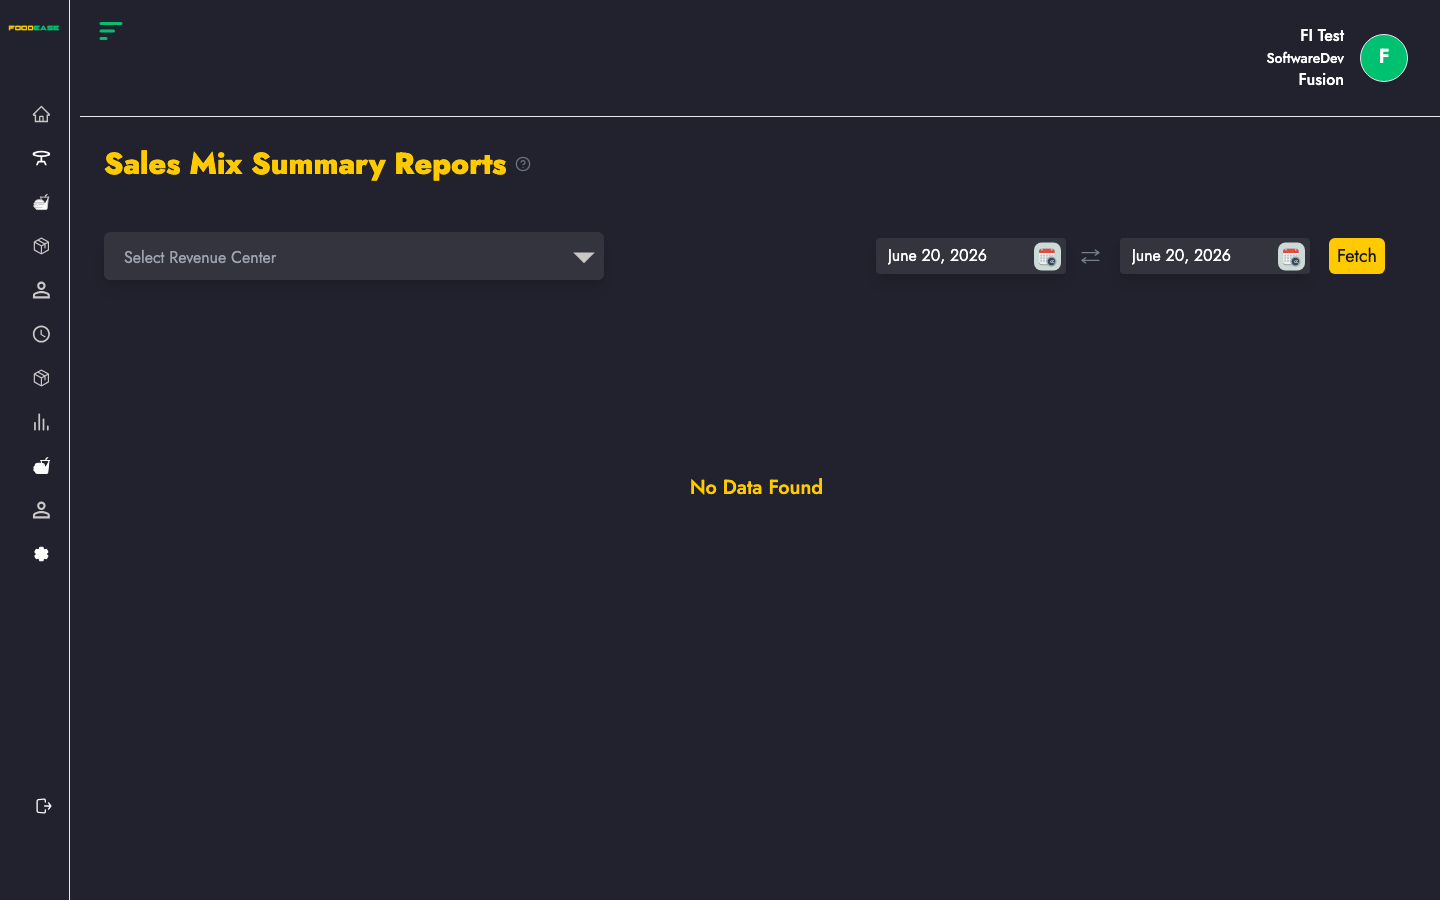
Run the report
Most reports share the same controls at the top of the page:
| Control | Purpose |
|---------|---------|
| Date range | Set Date From and Date To, then apply the filter to load data |
| Revenue centre | Optional — limit results to one outlet; leave blank for all centres |
| Print / Export | Use the header actions to print or download (PDF/Excel where available) |
After you set filters, the table or chart refreshes with data for that period.
What this report shows
Highlights which items and categories contribute most to revenue as a share of total sales.
Tips
- Start with a short date range (today or this week) to confirm the layout before running month-end reports.
- Pair operational reports with Sessions to reconcile cashier shifts.
- Return to View All Reports to browse every available report or set up Automated Reports.